Title 22, §8736, requires the MHDO to produce and post on its publicly accessible website an annual Drug Price Transparency Report. The content of the report is to include information developed from the disclosures submitted to MHDO per the requirements of 90-590 Chapter 570, Uniform Reporting System for Prescription Drug Price Data Sets, from manufacturers, wholesale drug distributors and pharmacy benefits managers, referred to as reporting entities. Specifically, the report provides information on trends in the cost of prescription drugs, analysis of manufacturer prices and price increases, the major components of prescription drug pricing along the supply chain, and the impacts on insurance premiums and cost sharing and any other information the MHDO determines is relevant to providing greater consumer awareness of the factors contributing to the cost of prescription drugs in the State.
Under contract with MHDO, Ten2Eleven Business Solutions provided MHDO technical support in the preparation of this report.
This is MHDO's fourth annual report.
Previous reports are available below.
To jump to an area of specific interest click the links below:
Highlights and conclusions of MHDO’s fourth annual report include:
Primary entities in the pharmaceutical supply chain include:
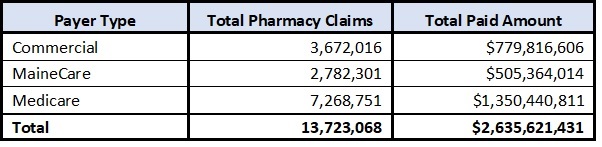
In 2022, prescription drug payments reported to the MHDO for all NDCs per the requirements in 90-590 Rule Chapter 243, Uniform Reporting System for Health Care Claims Data Sets, was approximately $2.6B, representing approximately 24% of all payments reported to MHDO. A breakdown of pharmacy claims by payer type is provided in the table below.
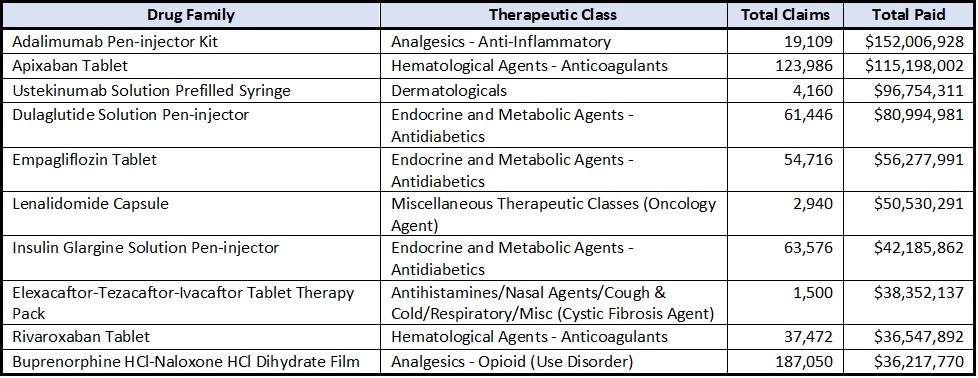
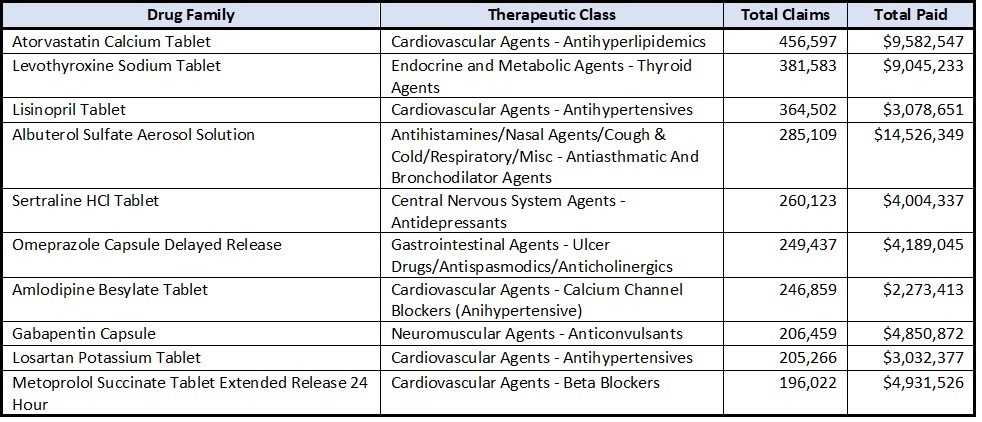
The top 10 most costly drug families based on MHDO data in 2022 are shown in the table below. Drug families are groups of drugs that share a unique generic drug description (non-trade name) and drug form.
The top 10 most utilized drug families based on MHDO data in 2022 are shown in the table below.
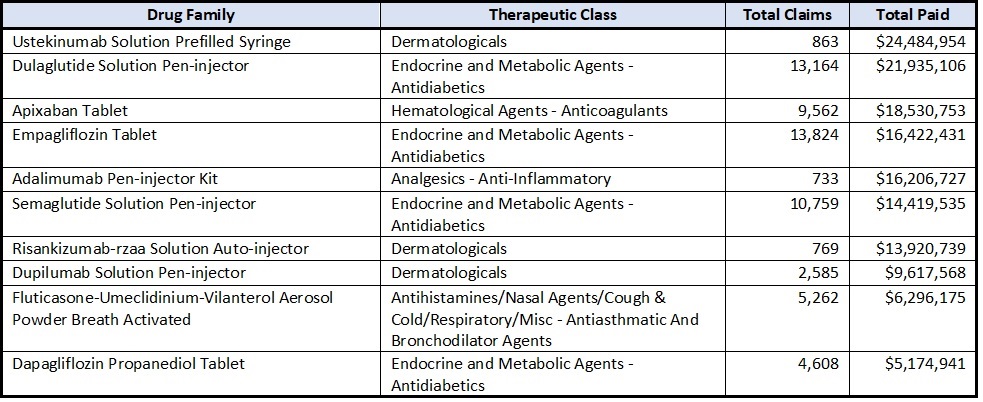
The top 10 drug families with the highest year over year paid amount increase in 2022 based on MHDO data are shown in the table below.
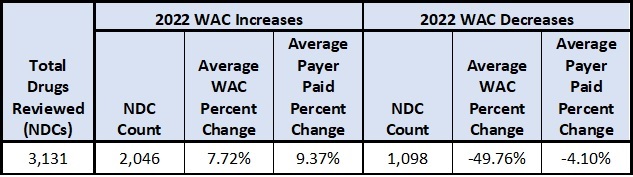
MHDO used publicly available prescription drug pricing data to analyze changes in the wholesale acquisition costs of drug products set by pharmaceutical manufacturers over the previous five years for all drug products with at least one claim reported in the MHDO’s data during 2022 (active NDCs – see footnote 3).
See the table and chart below.
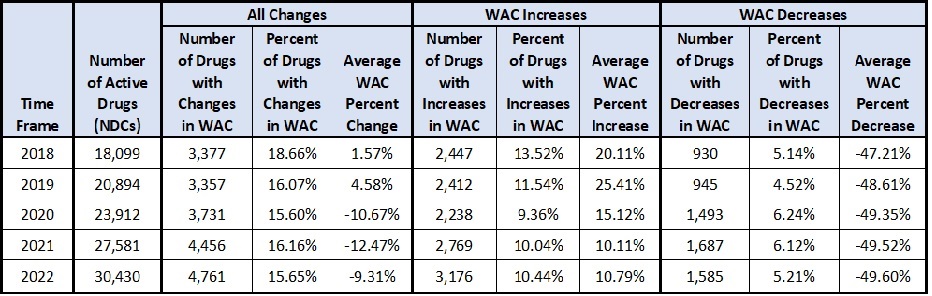
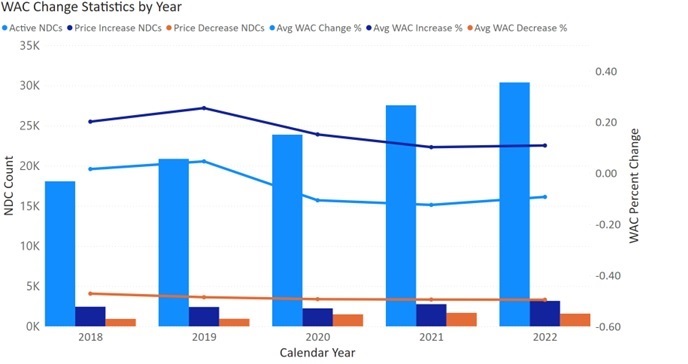
Of 42,496 active brand and generic prescription NDCs in the pharmaceutical market, Mainers filled prescriptions for 30,430 drugs in 2022.
Less than 1% of these drugs (70 drugs total – 64 brand drugs and 6 generic drugs) had increases in the wholesale acquisition costs in 2022 of more than 20%.
Impact of Changes in the Wholesale Acquisition Costs on Pricing for Multisource Drug Products
MHDO used pricing component data submitted by manufacturers, wholesale distributors and pharmacy benefit managers (referred to as reporting entities) per the reporting requirements in 90-590 Chapter 570, Uniform Reporting System for Prescription Drug Price Data Sets, to evaluate the difference in the Wholesale acquisition cost between brand and generic drugs for products where brand and generic equivalents were available during the year (multisource drug products). Of 37 multisource drugs reviewed, each had generic versions priced lower than their brand equivalents before and after application of changes in the wholesale acquisition costs. On average the generic drugs in this sample were 68.85% less than the brand name drugs. After incorporating rebate information, when generic drugs were dispensed, the cost to payers was significantly lower than what was paid when equivalent brand name products were used, with an average net cost reduction of 61.13% (see footnote 4).
Brand to Generic Drug Utilization in Maine
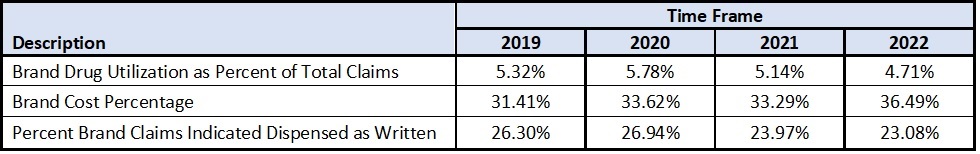
In CY 2022 the MHDO claims data shows that consumers in Maine were provided brand drug products for 4.71% of claims where generic drugs were alternatively available, which is slightly lower than 2021. Payments for brand name drugs reported in the MHDO claims data made up 36.49% of total payment amounts from payers and consumers for multisource drug products (see footnote 5). A comparison of year-over-year brand to generic drug utilization statistics is provided in the table below.
Consistent with previous reports, MHDO analyzed the pharmaceutical claims data submitted to MHDO per the requirements of 90-590 Chapter 243, Uniform Reporting System for Health Care Claims Data Sets, to evaluate the impact of both increases and decreases in the wholesale acquisition costs on actual amounts paid by payers during the reporting period. This Analysis was limited to 3,144 drugs (specifically NDCs) that incurred a change in the WAC during 2022 and for which claims were incurred both before and after the changes in the WAC.
Wholesale Acquisition Cost (WAC) & the Relationship to Payer Paid Amounts
Average Wholesale Price (AWP) & the Relationship to Payer Paid Amounts
Commercial payers (insurance companies) engage a pharmacy benefits manager (PBM) to negotiate payment rates between the commercial payer and the pharmacies for the drugs that the pharmacies dispense.
Negotiated payment rates are typically derived as a percentage-based discount from the average wholesale price (AWP) plus a fixed price dispensing fee. Manufacturers may provide publishers of AWP with a suggested AWP value or specify a markup value to be applied to WAC. Where manufacturers do not provide AWP guidance, the value is typically set as a 20% markup over WAC.
MHDO organized the NDCs analyzed above into brand and generic items and categorized them by source type (single source vs. multisource) to evaluate differences in pricing behaviors and methods across categories. AWP values were also incorporated for comparison to WAC and claims paid values. Statistical outcomes of the analysis are provided in the table below.
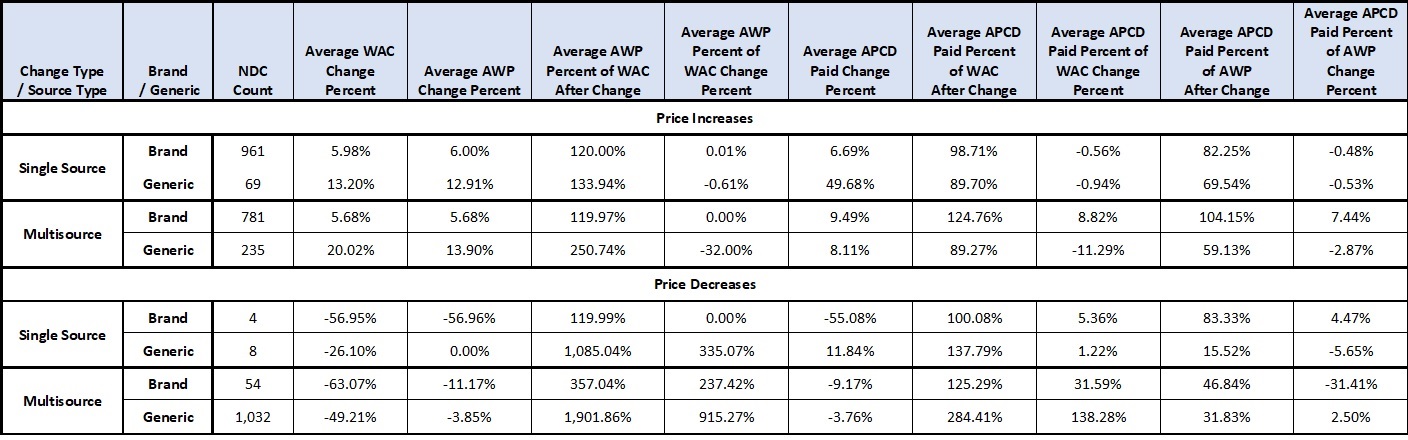
Key findings based on MHDO’s sample of prescription drugs
MHDO reviewed AWP price history for the generic drugs reviewed and found that AWP values were often set by manufacturers as a discount from the WAC or AWP value of the equivalent brand drug as it existed at the time the first generic product was introduced to market. For generic drugs, AWP often does not change as the value of WAC changes over time. As a result, while WAC prices differ between generic manufacturers, AWP prices show very little variation and are often the same across manufacturers. This pricing practice differs from brand drug pricing where manufacturers typically do not provide AWP guidance resulting in a default AWP value of 120% of WAC.
Pharmacies are able to reduce the cost of drug inventory by acquiring generic products from manufacturers with the lowest WAC. However, payers do not receive a corollary benefit from lower WAC prices when AWP, the basis for pharmacy reimbursement, remains static across generic manufacturers. Instead, the reductions the manufacturers make in WAC result in a higher margin to the pharmacy – in some instances a pharmacy receives greater income for a product than the product’s manufacturer.
Analysis of pricing component data provided to MHDO by PBMs via 90-590 Chapter 570, Uniform Reporting System for Prescription Drug Price Data Sets, shows that negotiated payments made by payers and consumers to pharmacies were higher than what pharmacies paid to Wholesaler Distributors to acquire the drug dispensed by an average margin of 11.75% for brand NDCs and 630.44% for generic NDCs.
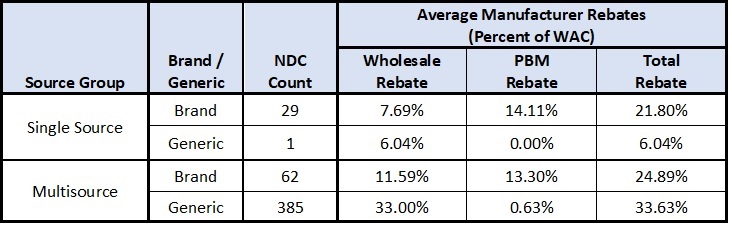
Prescription drug rebates accrue as drug products are purchased and dispensed between manufacturers, wholesale distributors, pharmacy benefits managers and payers over time and may represent a fixed amount per unit or a percentage of an agreed upon price point such as WAC. MHDO reviewed 477 unique brand and generic drugs (specifically NDCs) for which pricing component data was submitted to MHDO per the requirements of 90-590 Chapter 570, Uniform Reporting System for Prescription Drug Price Data Sets, and MHDO’s commercial claims data was submitted by payers per the requirements of 90-590 Chapter 243, Uniform Reporting System for Health Care Claims Data Sets, for the time period 2022.
A summary of the average manufacturer rebates reported to MHDO for 2022 is provided in the table below. Rebate percentage values are calculated at the drug (NDC) level for each reporting entity as the total rebate receivable amount divided by the total number of whole NDC units sold by wholesalers or administered by PBMs (i.e., the total rebate receivable per NDC unit) divided by the average WAC amount (see footnote 6) for the NDC.
After manufacturer rebates to PBMs are passed through to commercial payers (referred to as payers), the amount that was initially paid to pharmacies by payers was offset by 10.17% for brand NDCs and 0.05% for generic NDCs. If rebate amounts were distributed between payers and consumers at the point of sale (when the consumer is at the pharmacy), consumers would have realized out-of-pocket cost savings of approximately 9.20% for brand name NDCs.
Overall, for the subset of 477 NDCs reviewed by MHDO, the average amount paid by payers (including member cost share) after rebates for a given NDC was 84.32% of the average WAC amount for brand NDCs and 335.36% for generic NDCs.
Primary entities in the pharmaceutical supply chain include:
The pharmaceutical supply chain is complex with steps that include physical product acquisition as well as transactional elements triggered by contractual agreements between participants. A summary of the major supply chain components are described below:
Wholesaler Acquisition - First step in the Supply Chain
A wholesaler’s acquisition of drug products from manufacturers is the first step in the supply chain. Typically, wholesalers purchase drug products at the WAC and store them in distribution centers until the products are later purchased by pharmacies. Contracts between manufacturers and wholesalers may provide for accrual of rebates to be paid to the wholesaler when the wholesaler later sells the product to a pharmacy. MHDO used pricing component data provided by wholesalers for calendar year 2022 as defined in 90-590 Chapter 570, Uniform Reporting System for Prescription Drug Price Data Sets, to calculate the percent of acquisition costs that are rebated from manufacturers to wholesalers on a per unit basis. Rebate percentage values are calculated at the drug (NDC) level for each wholesaler as the total rebate receivable amount divided by the total number of units sold (the total rebate receivable per unit) divided by the wholesaler’s average acquisition amount per unit for the NDC. On average wholesalers received rebate amounts of 10.47% for brand drugs and 32.54% for generic drugs (28.36% overall) when applied against acquisition cost on a per unit basis.
Acquisition of drug products by wholesalers is typically the last point in the pharmaceutical supply chain where WAC is used as the price point of a transaction. From this point forward, WAC is instead used as a basis from which price values (AWP, manufacturer rebates, etc.) are derived through the application of mark ups and/or discounts from the value of WAC.
Pharmacy Acquisition of Drug Products
The next step in the pharmaceutical supply chain is a pharmacy’s purchase of drug products from a wholesale distributor (wholesalers). Typically, wholesalers sell drug products to pharmacies at or below then current WAC values. Analysis of MHDO’s pricing component data shows that annual revenues generated by wholesalers from sales to pharmacies were less than amounts spent by wholesalers to acquire the products from manufacturers by 16.93% for brand NDCs and 54.68% for generic NDCs (47.55% overall). Pharmacy costs were further reduced through rebates received from wholesalers by an average of 0.63% for brand NDCs and 5.46% for generic NDCs (4.54% overall).
Wholesalers generally sell drugs to pharmacies for less than the amount they spend to purchase the drugs from manufacturers. This cost reduction develops through several factors:
Purchasing a Prescription Drug Under a Commercial Insurance Plan – Consumers, Payers and PBMs
The final components of the supply chain are initiated when a consumer submits a prescription at a pharmacy.
Consumer Payment
When an insured consumer submits a prescription, the pharmacy submits a claim for reimbursement to the Pharmacy Benefits Manager (PBM) contracted with the insured’s commercial payer. The PBM then adjudicates the claim to determine the amount of reimbursement to which the pharmacy is entitled based on its contracted rate with the payer. In addition, the PBM notifies the pharmacy of the share of reimbursement that should be collected from the insured at the time the prescription is filled.
Payer Payment
Commercial payers engage PBMs to negotiate rates with pharmacies for the drugs the pharmacies dispense. As prescriptions are filled, PBMs charge payers their contracted rate less the consumer payment amount and facilitate payment to the pharmacy.
Rates negotiated between pharmacies and payers are typically derived as a percentage-based discount from Average Wholesale Price (AWP) plus a fixed price dispensing fee. Pharmaceutical Manufacturers may provide publishers of AWP with a recommended AWP value or specify a markup value to be applied to WAC. Where manufacturers do not provide AWP guidance, the value is typically set as a 20% markup over WAC. The amount that a pharmacy is reimbursed by a payer (including consumer cost share) above the cost the pharmacy paid to procure the drug product can vary greatly from one NDC to another depending on the amount that AWP is marked up from WAC.
Another variable in prescription drug pricing is the method by which PBMs are paid for the services they provide. In some instances, the PBM charges the payer a contracted price for prescription drugs, and the contracted price for the prescription drugs differs from the amount the PBM pays the pharmacy – this arrangement is referred to as spread pricing. Payers, manufacturers, and pharmacies may also pay PBMs administrative fees for their services.
Analysis of MHDO’s pricing component data provided by PBMs shows that, on average, PBMs retained payments from payers in the form of spread and/or administrative fees at a rate of 1.19% above what PBMs reimbursed to pharmacies for brand NDCs and 26.94% for generic NDCs (22.07% overall).
As reported in the MHDO’s commercial claims data for the subset of 477 NDCs reviewed, and after consideration for spread pricing and/or administrative fees paid to PBMs, amounts paid by payers and consumers to pharmacies were higher than amounts paid by pharmacies to wholesalers by an average margin of 11.93% for brand NDCs and 628.72% for generic NDCs (512.10% overall).
Manufacturer Rebate Payment to PBMs
In addition to negotiating pharmacy reimbursement rates, PBMs develop and maintain drug formularies used by payers to determine the level of cost sharing for specific drugs between a payer and its members. Drugs on a formulary are divided into tiers with different cost share ratios. Drugs on less preferable tiers result in higher out of pocket costs for members. To achieve placement on preferred formulary tiers, manufacturers negotiate rebates, based on a percentage of WAC, that are payable to PBMs as drug products are dispensed. PBMs then pass through some or all of the rebates to payers, reducing the net amount paid by the payer for the specific drug product. The difference between the rebate amount received and the rebate amount passed through is retained by the PBM as revenue.
Pricing component data reported to MHDO by PBMs shows that, on average, PBMs received rebates from manufacturers representing 13.27% of the average WAC amount for brand NDCs and 0.64% for generic NDCs (3.03% overall). Of the overall amount of rebates in the sample approximately 51.43% was passed through to commercial payers.
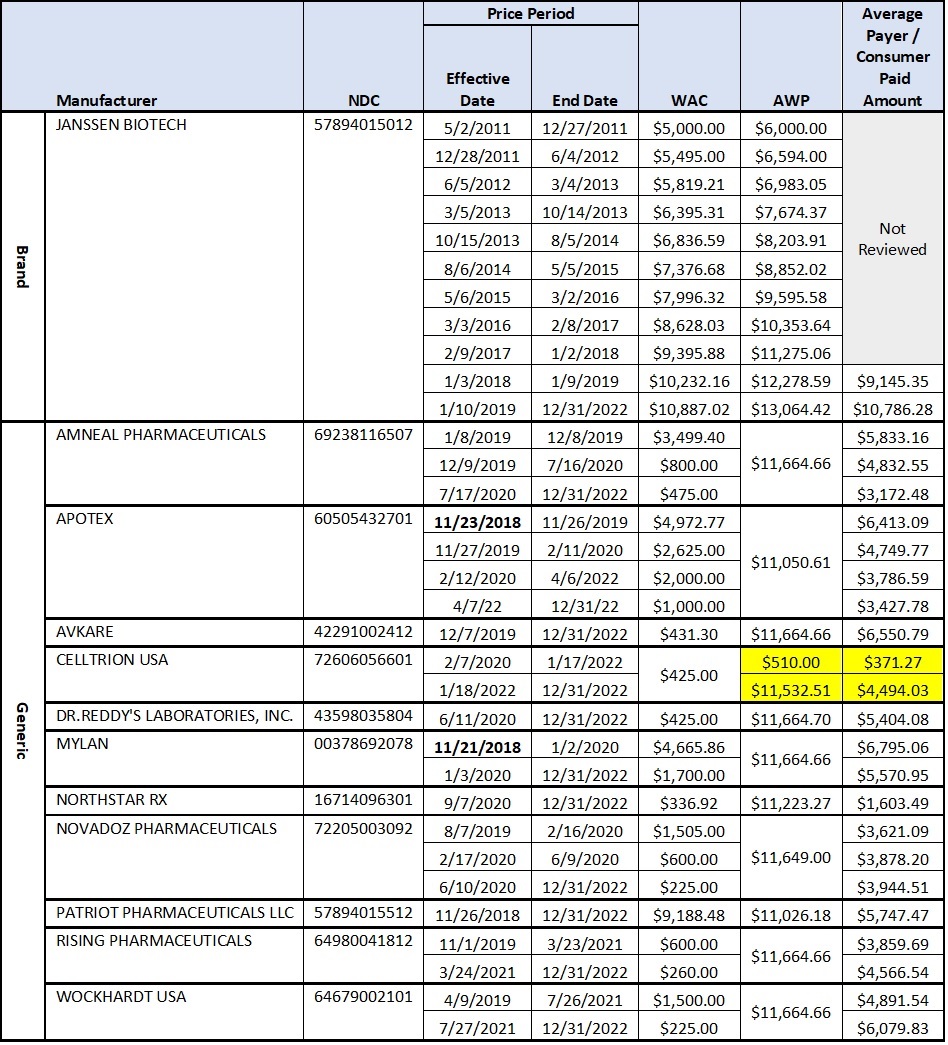
Zytiga (Abiraterone Acetate) 250 Mg 120 Count Tablets – a typical 30-day supply used for Prostate Cancer that has spread.
MHDO reviewed brand and generic WAC and AWP manufacturer pricing to amounts paid by payers and consumers between 2019 and 2022 for the multisource drug product Zytiga (Abiraterone Acetate) 250 Mg 120 Count Tablets. Zytiga is used to treat men with prostate cancer that has spread to other parts of the body. Pharmacy claims reported to MHDO for the drug totaled $25.4M during the four-year period (2019-2022).
Background Information:
See the table below which details the values of WAC, AWP, and Average Payment Amounts for a 30-day course of therapy of Abiraterone Acetate 250 Mg tablets for each manufacturer price period.
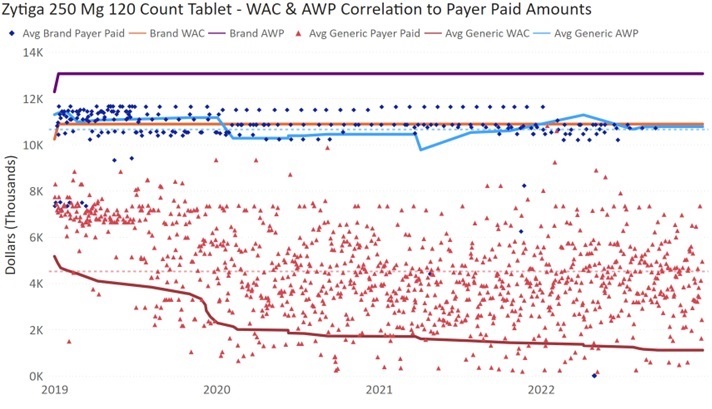
Zytiga 250 Mg 120 Count Tablets – WAC & AWP Correlation to Payer Paid Amounts
During the four-year period for which MHDO prescription claims were reviewed (2019-2022):
In February 2020, the manufacturer Celltrion introduced its generic Zytiga product to market with a WAC price of $425.00 and did not specify an AWP price. As a result, data publishers established a default AWP of $510.00 based on the value of WAC + 20%. AWP remained $510.00 from February 2020 to January 2022. During this period, payers paid an average of $371.27 for a 30-day course of therapy for the Celltrion product.
In January 2022, Celltrion increased the AWP of their generic Zytiga product from the default value of $510.00 to a specified value of $11,532.11. Celltrion did not increase the value of WAC which remained $425.00. After the AWP increase, the average amount paid by payers for the Celltrion product increased by 1,210.45% to $4,494.03. See highlighted values in the table above.
Although Celltrion specified a higher AWP for this drug, they did not receive additional payment from purchasers of their product as a result of the increase. However, after increasing the basis value for payment to pharmacies (AWP) without increasing the drug cost (WAC), Celltrion increased its market share in Maine from 0.69% of prescriptions filled between 2020 and 2021 to 14.4% of prescriptions filled in 2022.
A visual correlation of average claim paid amounts to WAC and AWP values for brand and generic products is provided in the chart below.
MHDO Rule Chapter 570, Uniform Reporting System for Prescription Drug Price Data Sets
90-590, CMR Chapter 570, Uniform Reporting System for Prescription Drug Price Data Sets, defines the requirements for the registration of reporting entities; conditions under which MHDO must provide notice of substantial drug price changes or introductions; conditions under which the MHDO requires pricing component data from a reporting entity; the data elements contained in the various reports; proper coding, formatting, and submission of data; and submission deadlines.
As of October 24, 2023, 591 pharmaceutical manufacturers, 204 wholesale drug distributors and 34 pharmacy benefit managers have registered with the MHDO.
Public Notice of Substantial Drug Price Change or Introduction
Beginning January 30, 2022, MHDO is required to compile and publicly post on its website a list of all prescription drugs for which a manufacturer has during the prior calendar year:
Notifications by MHDO to Reporting Entities
Beginning February 15, 2022, and annually thereafter, MHDO must produce and post on its publicly accessible website a list of drug product families for which it intends to require reporting of pricing component data by reporting entities. In determining this list, MHDO considers the relevance of specific drug products in providing greater consumer awareness of the factors contributing to the cost of prescription drugs in the state. MHDO included 74 drug product families in the list for calendar year 2022, each having one or more NDCs that was:
MHDO Notification to Reporting Entities requesting Pricing Component Data
MHDO is responsible for identifying specific drug products of interest and notifying reporting entities that they must report pricing component data to MHDO as defined in 90-590 CMR Chapter 570, Uniform Reporting System for Prescription Drug Price Data Sets, for those drug products. Each drug product is identified by its NDC. Throughout the report, NDC is used to describe a manufacturer specific drug product.
MHDO requested pricing component data from reporting entities for 807 NDCs (which represents less than 1% of all NDCs) that are manufactured by 124 distinct manufacturers. Of these NDCS, 119 were brand drugs and 688 were generic drugs.
Data Consolidation and Analysis
Pricing component data files for CY 2022 were submitted by reporting entities to the MHDO Prescription Drug Price Data Portal in the summer of 2023. The subset of NDCs for which MHDO received pricing component data is used to highlight pricing, rebate, and brand to generic drug utilization statistics for drugs identified as having high impact to prescription drug costs in Maine.
In addition to incorporating data submitted by reporting entities in this annual report, MHDO included descriptive drug product and historical pricing information compiled from Wolters Kluwer’s Medi-Span MedFile v2 data file, and pharmaceutical claims data submitted to the MHDO APCD as required by 90-590 Rule Chapter 243, Uniform Reporting System for Health Care Claims Data Sets. These supplemental data sets enabled review of claim volume and costs before and during the 2022 reporting period. Additionally, portions of the report use supplemental data to expand beyond NDCs reported by reporting entities to show more general trends in the overall prescription drug marketplace.
1WoltersKluwer Website. AWP Policy. Accessed September 7, 2022 at https://www.wolterskluwer.com/-/media/project/wolterskluwer/oneweb/www/health/ce/files/clinical/wkh-awp-policy.pdf
2Pharmacies may also contract directly with manufacturers to procure drug products. In these cases, MHDO assumes pharmacy acquisition costs are more favorable than what is otherwise available from wholesalers, increasing pharmacy profitability. All other supply chain components remain the same.
3Active NDCs are those NDCs that are currently available in the market.
4Average net costs were determined by decreasing the total paid amount reported by payers by the average rebate amount reported by reporting entities for the same NDCs on a per unit basis.
5Claim payments do not reflect the effect of drug rebates. 23.08% of the brand claims represented for 2022 were prescribed as Dispense As Written, indicating the medical provider determined that the branded NDC was more appropriate for the consumer and should not be filled as a generic.
6Average WAC is calculated by summing the mathematical product(s) of the number of days during the year a drug product is priced at a unique WAC value multiplied by the unique WAC value and dividing the sum of all mathematical products by the number of days in the year. ((($a x 31 days) + ($b x 150 days) + ($c x 184 days)) / 365 days).