Public Law 2021, Chapter 606 (LD 1636), An Act To Determine Potential Savings in Prescription Drug Costs by Using International Pricing , requires the Maine Health Data Organization (MHDO) to produce an annual report beginning in January 2023 that provides information regarding potential savings that could be achieved by subjecting drugs identified as the costliest and most frequently prescribed in the State of Maine to a referenced rate as defined in the law. This is MHDO's second annual report. MHDO's first annual report can be found here: https://mhdo.maine.gov/RxReferenceRates_Historical.htm.
Brand Drug – a prescription drug, having a unique NDC, marketed under a proprietary name or registered trademark name, including a biological product, and approved under a New Drug Application or Biologics License Application.
Drug Identification Number (DIN) – a computer-generated eight-digit number assigned by Health Canada to a drug product prior to being marketed in Canada. A DIN uniquely identifies the following product characteristics: manufacturer; product name; active ingredient(s); strength(s) of active ingredient(s); pharmaceutical form; route of administration.
Generic Drug – a prescription drug, having a unique NDC, whether identified by its chemical, proprietary or nonproprietary name, that is not a brand drug, is therapeutically equivalent to a brand drug in dosage, strength, method of consumption, performance and intended use, and approved under an Abbreviated New Drug Application. Generic Drug includes a biosimilar product.
Multi-Source Drug – a brand drug or generic drug that is available from more than one manufacturer.
National Drug Code (NDC) – a code maintained by the US Food and Drug Administration that is uniquely assigned by manufacturer, product, and packaging.
Pharmaceutically Equivalent Drug Products - brand drugs and/or generic drugs that are identical in active ingredient(s), dosage form, route of administration, and strength or concentration
Prices on Canadian Provincial Formularies - represent amounts paid by payers in the province
Single Source Drug – a brand drug or generic drug that is only available from one manufacturer.
Wholesale Acquisition Cost (WAC) – a manufacturer’s published list price for sale of a prescription drug product with a unique NDC to a wholesale drug distributor or other entity that purchases a prescription drug directly from the manufacturer, not including any price concessions. WAC represents the price paid in the US to manufacturers by drug wholesalers and almost never reflects actual amounts paid by payers in the US.
The following provisions in statute govern the determination of referenced rates of prescription drugs.
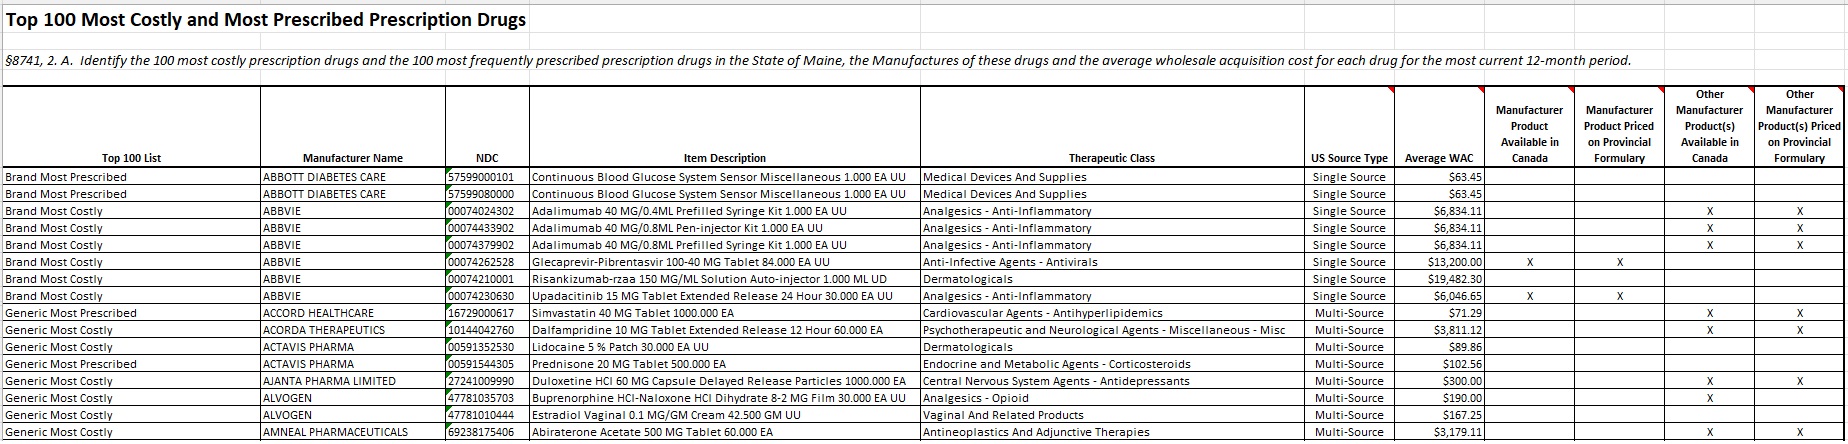
§8741, 2. A. Identify the 100 most costly prescription drugs and the 100 most frequently prescribed prescription drugs in the State of Maine, the Manufactures of these drugs and the average wholesale acquisition cost for each drug for the most current 12-month period.
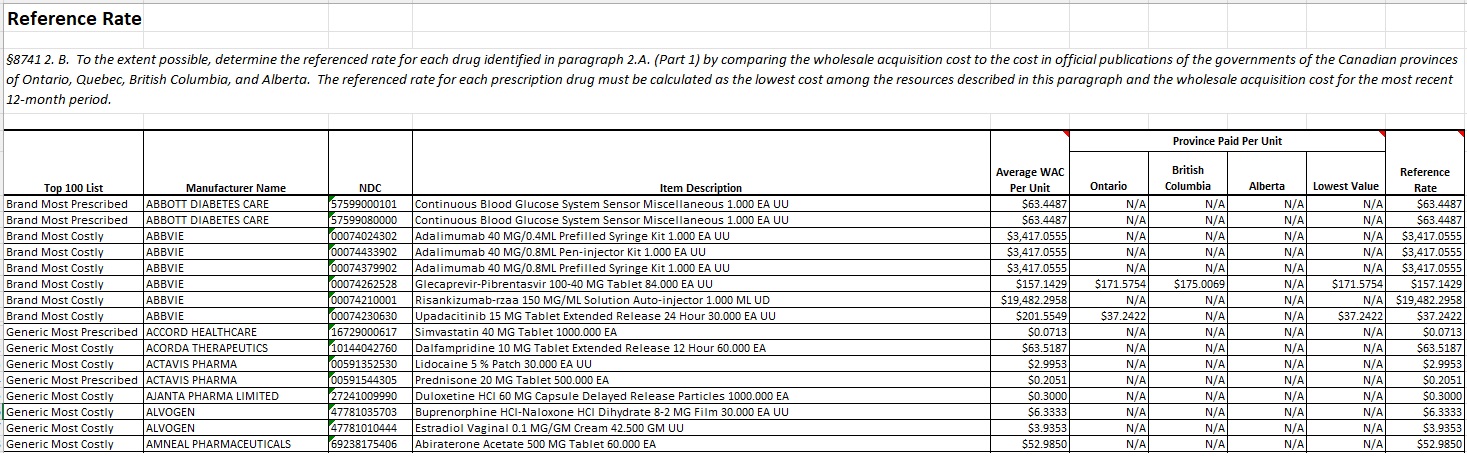
§8741 2. B. To the extent possible, determine the referenced rate for each drug identified in paragraph 2.A. (Part 1) by comparing the wholesale acquisition cost to the cost in official publications of the governments of the Canadian provinces of Ontario, Quebec, British Columbia, and Alberta. The referenced rate for each prescription drug must be calculated as the lowest cost among the resources described in this paragraph and the wholesale acquisition cost for the most recent 12-month period. If a specific drug identified in paragraph A is not included within the resources described in this paragraph, MHDO shall use for the purpose of determining the referenced rate the ceiling price for drugs as reported in other official publications of the government of Canada.
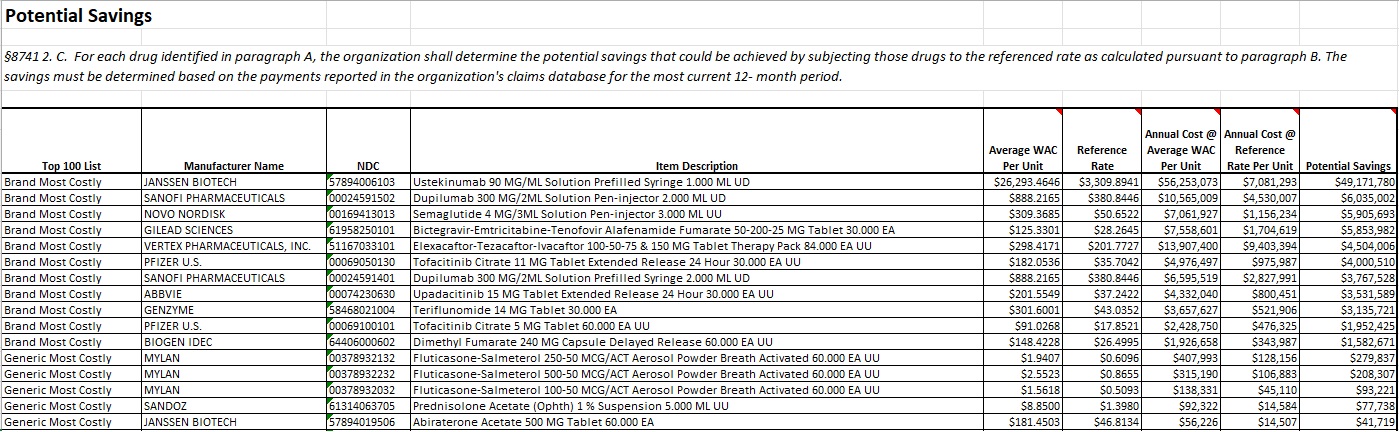
§8741 2. C. For each drug identified in paragraph A, the organization shall determine the potential savings that could be achieved by subjecting those drugs to the referenced rate as calculated pursuant to paragraph B. The savings must be determined based on the payments reported in the organization's claims database for the most current 12- month period.
| Report Year | Distinct NDCs |
NDCs for which Reference Rate can be calculated |
NDCs with Reference Rate based on WAC Pricing |
NDCs with Reference Rate based on Canadian Pricing |
Total Potential Savings |
|---|---|---|---|---|---|
| 2022 | 286 | 93 | 21 | 72 | $146.7M |
| 2023 | 282 | 88 | 23 | 65 | $171.1M |
Under contract with MHDO, Ten2Eleven Business Solutions provided MHDO technical support in the preparation of this report.
MHDO performed its analysis using descriptive drug product, pharmaceutical equivalency, and historical pricing information compiled from Wolters Kluwer’s Medi-Span MedFile v2 (MediSpan) and Canadian Drug File data files, and pharmaceutical claims data submitted to the MHDO All Payer Claims Database as required by 90-590 Rule Chapter 243, Uniform Reporting System for Health Care Claims Data Sets, for the most recent 12-month period (April 1, 2022 – March 31, 2023).
Manufactures are incorporated as different corporate entities in the US and Canada. To compare country to country pricing between products by manufacturer, MHDO developed a crosswalk of US and Canadian manufacturers. Where possible, manufacturers were mapped by associating similar corporate names; when no match was found, MHDO performed internet research to determine corporate relationships between US manufacturers of NDCs on the Top 100 List and manufacturers of pharmaceutically equivalent products in Canada.
The MediSpan and Canadian Drug Files share a common proprietary data element that is maintained by Wolters Kluwer to denote pharmaceutically equivalent drug products. This Generic Product Identifier (GPI) was used together with the manufacturer crosswalk to map products that are identical with respect to active ingredient(s), dosage form, route of administration, and strength or concentration but without considering the presence of inactive ingredients.
Where US NDCs could be mapped to a Canadian DIN, and were priced on at least one provincial formulary, MHDO determined a Reference Rate for the NDC as described in §8741 2. B. Province pricing was evaluated based on amounts published as applicable for October 31, 2023, adjusted for the US / Canadian exchange rate of 1.3877 posted by the Wall Street Journal as of the close of the market on Tuesday, October 31, 20231. Reference Rate values were calculated per NDC unit of measure.
MHDO next calculated potential savings that could be achieved by subjecting NDCs on the Top 100 List to the Reference Rate. MHDO first determined the total quantity dispensed (by NDC unit of measure) and average percent markup above/below WAC for commercial claims during the claim review period (April 1, 2022 – March 31, 2023). The average rate of markup above/below WAC was then applied to both the average WAC per NDC unit of measure2 and the Reference Rate, and both metrics were multiplied by the dispensed quantity. Finally, resultant values were compared to determine total potential savings for each NDC
Potential savings values were updated on January 24, 2024, to incorporate additional claims for the claim review period (April 1, 2022 – March 31, 2023) that were initially omitted in error.
MHDO received one time funding from an external source to cover the annual data acquisition cost for the Canadian Drug File. Funding is needed to continue MHDO’s subscription to the data file on an annual basis.
MHDO posted this report December 7th, 2023
Footnotes:
11 Wall Street Journal Website. Markets. Accessed November 6, 2023 at https://www.wsj.com/market-data/quotes/fx/USDCAD/historical-prices
2 Average WAC per NDC unit of measure was calculated by summing the mathematical product(s) of the number of days during the most recent 12-month period (November 1, 2022 – October 31, 2023) that a drug product was priced at a unique WAC per unit value multiplied by the unique WAC per unit value and dividing the sum of all mathematical products by the number of days in the 12-month period. ((($a x 31 days) + ($b x 150 days) + ($c x 184 days)) / 365 days)