
This report was originally developed in response to a request from the Task Force on Health Care Coverage for All of Maine to provide information on cost drivers for medical procedures in the State, separately for inpatient and outpatient procedures, by insurance markets. The report is based on the MHDO All-Payer Claims Data. Visit the Methodology Notes to learn more.
The interactive report below includes two views:
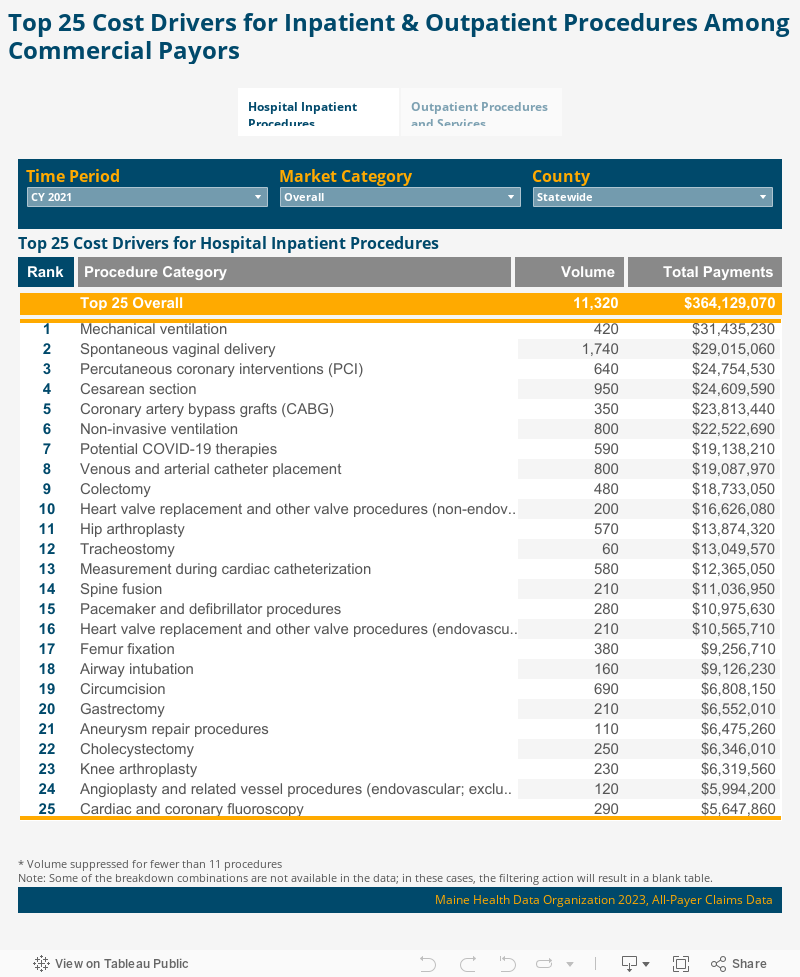
The procedures are ranked by the total payments cumulated in a calendar year (CY).
Use the tabs "Hospital Inpatient Procedures" and "Outpatient Procedures and Services" at the top of the report to select a view. Results may be filtered by Time Period, Market Category, and County (based on servicing provider’s location), and column headers (Rank, Procedure Category, Volume, and Total Payments) may be hovered over for additional information.
Inpatient: Statewide, across all market categories, the inpatient procedure category that ranked the highest based on Total Payments in CY 2021 is “Mechanical ventilation”; procedures in this category rank higher than in CY 2020 (ranked 5th), primarily driven by an increase in the volume of procedures performed (35% increase) and an increase in the estimated average cost per procedure (8% increase). In CY 2021, some potentially COVID-19 pandemic-related changes occurred. “Non-invasive ventilation” ranked higher in CY 2021 than in CY 2020 due to an increase in the number of procedures (38% increase) and an increase in the estimated average cost per procedure (17% increase). A new procedure category, “Potential COVID-19 therapies”, ranked 7th in CY 2021. Other notable changes are that the “coronary artery bypass grafts (CABG)” and the “heart valve replacement and other valve procedures (non-endovascular)” ranked lower in CY 2021 than in CY 2020 (2nd to 5th; 7th to 10th, respectively), which appears to be driven by a decrease in the estimated average cost per procedure (9% decrease; 30% decrease, respectively) despite increases in volume (9% and 18% increase, respectively).
Outpatient: The top 4 outpatient procedure and service categories have maintained the same ranks in CY 2021 as in CY 2020, for overall statewide procedures across all market categories. Among the top 10 procedure categories driving the Total Payments statewide in CY 2021 that were among top 10 categories in CY 2020 as well, each category has a higher volume of procedures when compared to CY 2020, with the highest percent increases for other laboratory (37% volume increase) and colonoscopy and biopsy procedures (31% volume increase). Most of the top 10 procedure categories also have increases in the estimated average cost per procedure, with the highest increases for durable medical equipment and supplies (19% increase from $199 to $237) and colonoscopy and biopsy (8% increase from $1,375 to $1,491).